March 2020
Site Updates
27 276 03 276 20 à13 11:21 Filed in: Notice
Practical informations
20 206 03 206 20 à27 13:22 Filed in: Notice
Practical informations for this new way of working.
You should watch the videos for P02
For the lab session watch the videos from P02
Remote teaching information
20 206 03 206 20 à48 00:42 Filed in: Notice
To follow the theoretical classes, use Zoom: https://videoconf-colibri.zoom.us/j/350976928.
For the practical lessons, the lesson is recorded (see here) and can in any case appear in the zoom:
. 14:10 - https://videoconf-colibri.zoom.us/j/467222695
. 18:10 - https://videoconf-colibri.zoom.us/j/829651269
This information is also available in the schedule.
You can also use the discussion forum.
VID Forum
20 206 03 206 20 à34 00:35 Filed in: Notice
The VID Forum was created and they are automatically registered.
URL: https://groups.google.com/d/forum/vid-19-20
Email: vid-19-20@googlegroups.com
URL: https://groups.google.com/d/forum/vid-19-20
Email: vid-19-20@googlegroups.com
No more face-to-face lectures and labs
12 125 03 125 20 à8 17:07 Filed in: Notice
- This Friday (March 13) there will be no classes.
- I will soon post the usual materials on the VID website (PDF of the theoretical and practice slides and summaries).
- I will give more information about the next steps through the VID website.
- I am studying the best (remote) alternatives so that we can continue our joint work. I will be giving the information through the website or any other platform that I see in the meantime.
The lectuers will be in room 128 - II
09 92 03 92 20 à47 18:23 Filed in: Notice
The lectures will be in room 128 - II
COVID-19 IDV built by Johns Hopkins CSSE
This suggestion is made by Joana Barradas
https://gisanddata.maps.arcgis.com/apps/opsdashboard/index.html#/bda7594740fd40299423467b48e9ecf6
https://gisanddata.maps.arcgis.com/apps/opsdashboard/index.html#/bda7594740fd40299423467b48e9ecf6
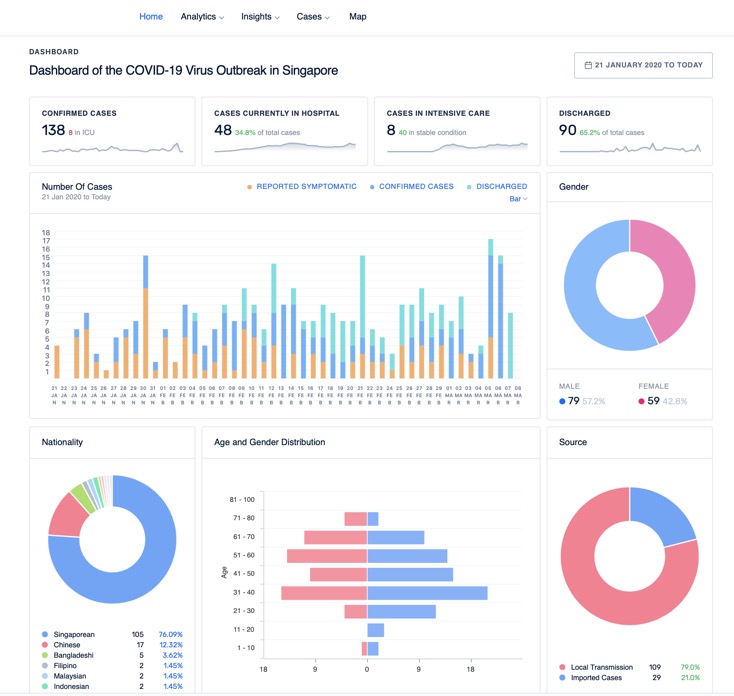
Covid - 19 @Signapure
Covid - 19 @Signapure
https://co.vid19.sg/dashboard
Check, explore the options in the menu, evaluate and prepare your opinion !

https://co.vid19.sg/dashboard
Check, explore the options in the menu, evaluate and prepare your opinion !

[CHALLENGE]: Facts, Data and Visualizations - Covid-19
Facts, Data and Visualizations - Covid-19
Check for Oficial Data
- Share (with the teacher) the links with data or reports or information
Check for Data Visualizations
- Make your own evaluation, select the ones worth to be shared
- Share (with the teacher) the links with data or reports or information
Next week we will discuss the shared material
Start here
https://www.who.int/emergencies/diseases/novel-coronavirus-2019
[IMPORTANT]: On March 6th, Friday we have the first lecture and Lab sessions
01 11 03 11 20 à1 16:56 Filed in: Notice
This first lecture will start at 16:10 (127 / Ed. II) and will be a full lecture.
The Lab sessions will also start this week !!!
The first one will be at 14:10 - Lab 114 (before the lecture)
The second one will be at 18:10 (lab 114 (after the lecture)
Bring your own headphones !
The Lab sessions will also start this week !!!
The first one will be at 14:10 - Lab 114 (before the lecture)
The second one will be at 18:10 (lab 114 (after the lecture)
Bring your own headphones !
Visualization and Data Science
01 11 03 11 20 à18 16:38 Filed in: Notice
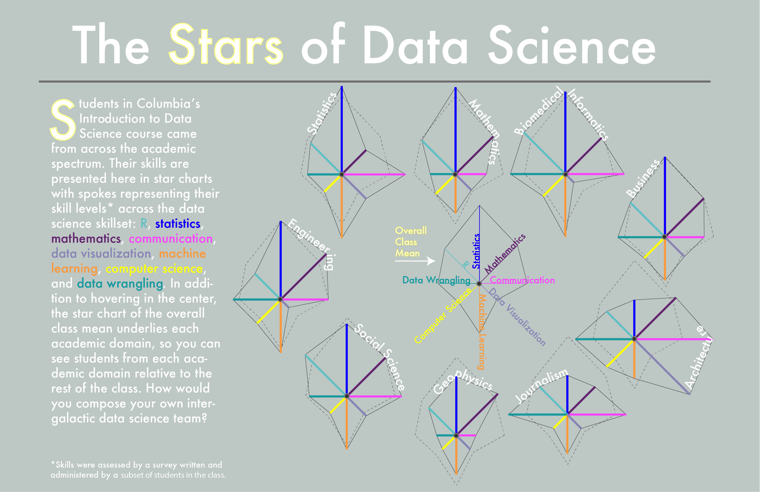
(Interactive Data) Visualization is a major component of Data Science. In the Columbia's Introduction to Data Science the student have different backgrounds. This image shows the students skills according 8 axes of competencies. See more here.


The IDV site is up and running
01 11 03 11 20 à14 16:38 Filed in: Notice
The site of Interactive Data Visualisation is up and running. This site is public and will be the most important communication channel with the students.
